
How much does it really push, and where does the water press on the blades? The answer in pictures.
Boat propeller CFD: what the simulation shows that the classical calculation does not
You have drawn a boat propeller in Heliciel, and you want to run it through CFD. The designer gave you a thrust, a torque, an efficiency. This case study shows what the CFD (Computational Fluid Dynamics, the numerical simulation of the flow) bench adds to those figures: a picture of the water around the propeller, the pressure on each blade, the jet it produces, and an answer to the question that worries every boat builder: will it cavitate?
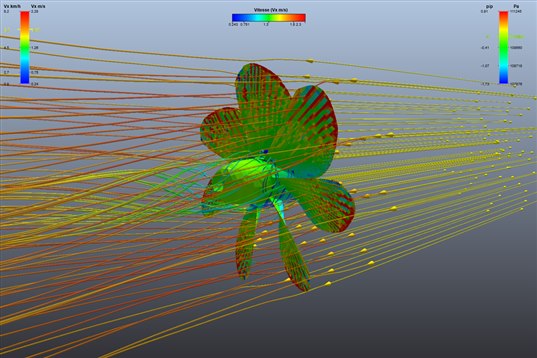
The marine propeller of the example, as the CFD bench shows it after the run: pressure on the blades (red = the water pushes, blue = the water pulls) and streamlines coloured by velocity. The fluid enters slowly on the right and leaves accelerated on the left.
- Contents:
- The machine and the operating point
- The boat propeller CFD: three clicks, twelve minutes
- Boat propeller thrust in CFD, compared with the classical calculation
- Where the water presses: the pressure map
- The jet and the wake
- The sailor's question: cavitation
- What vibrates: the blade pulsation
- Take-aways
1: The machine and the operating point
It is the marine propeller shipped as an example with Heliciel, at its design operating point. A fisherman's regime: slow, heavily loaded, in sea water.
| Diameter | 1,140 mm, hub ∅ 228 mm, 7 blades |
| Boat speed | 1.57 m/s (5.7 km/h, 3 knots) |
| Speed | 105 rpm |
| Fluid | sea water, 1,028 kg/m³ — shaft 1 m below the surface |
| Blade tip speed | 6.5 m/s |
Before CFD, the Heliciel designer already has its answer through the blade element method (BEM), the one that computes the blade slice by slice: 1,156 N of thrust and 253 N·m of torque. Those are the two numbers that CFD is going to put to the test.
2: The boat propeller CFD: three clicks, twelve minutes
Nothing to set in the fluid, nothing to write. From the designer, the PRO CFD menu sends the propeller to the test bench. Three actions follow:
- Pick a mesh preset. A list of levels, from the fastest to the finest. Here Level 5, a good compromise: 85,000 cells, meshed in 5 min 20 on a 6-core desktop PC.
- Mesh. The Mesh button. Wait.
- Compute. The Run Solver button. The bench itself chains the two phases of the computation: a first, fast one, where the propeller is frozen and the rotation simulated (1 min 58), then a second one where the propeller really rotates in the water (4 min 18). It stops on its own when the forces are stable.
Total: a little over twelve minutes, coffee included. The results appear in the Results tab, next to the 3D view.
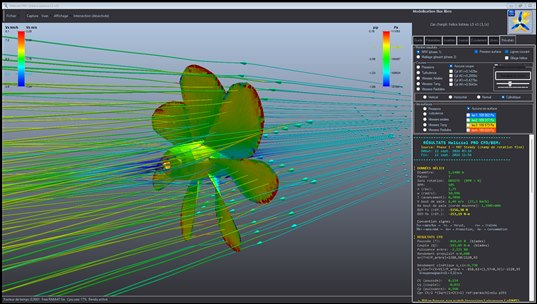
The CFD bench window after the run: the 3D view on the left, the display tick boxes and the results panel on the right. Everything shown on this page comes from there.
3: Boat propeller thrust in CFD, compared with the classical calculation
The results panel gives the forces on the blades and compares them with the designer's values:
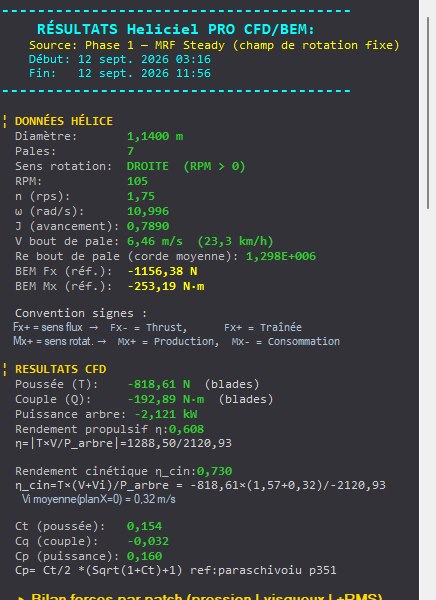
The results panel after the first phase: 818.6 N of thrust on the blades, 192.9 N·m of torque, 2.12 kW at the shaft, propulsive efficiency 0.608. The designer's (BEM) reference is recalled just above: 1,156 N and 253 N·m.
| Thrust (blades) | Torque (blades) | Duration | |
|---|---|---|---|
| Heliciel designer (BEM) | 1,156 N | 253 N·m | instant |
| CFD, phase 1 (frozen propeller) | 819 N (−29 %) | 193 N·m (−24 %) | 1 min 58 |
| CFD, phase 2 (rotating propeller) | 812 N (−30 %) | 175 N·m (−31 %) | 4 min 18 |
Two lessons, to be read as a technician and not as a numerical analyst:
- The two CFD phases tell the same story. Frozen or rotating propeller, we find 810-820 N again. The result is stable: it is not a computational accident.
- CFD finds less than the designer. About 30 % less. On a propeller with seven wide overlapping blades, the blade element method, which treats each slice of blade as isolated, is optimistic: the blades interfere with each other, and that is exactly what CFD sees and BEM cannot see. The message for the design office: keep a margin on the announced thrust, or test a variant with fewer blades.
The efficiency, on the other hand, holds up well: 0.608 in CFD against 0.654 at the designer. Thrust and torque fall short together, their ratio moves little.
4: Where the water presses: the pressure map
This is the picture the classical calculation cannot give. Tick Surface pressure, untick 3D model so that the grey shape does not cover the colours: the coloured blade is the result.
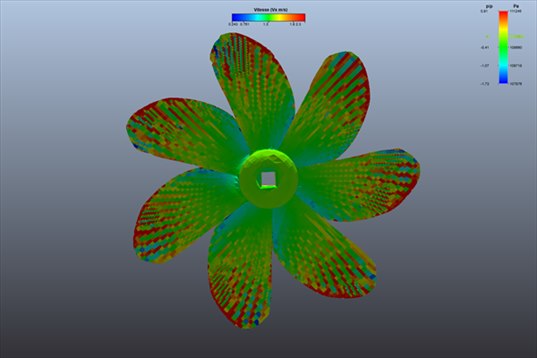
Seen from the back of the boat, the side where the propeller pushes the water. The trailing edges and blade tips are red: this is where the water presses hardest. The centre of the blades stays green, close to ambient pressure.
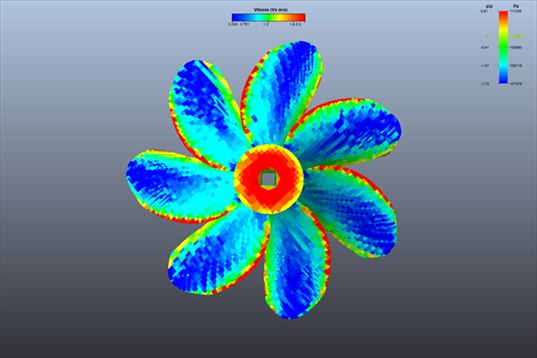
Seen from the front, hull side. The back of the blades is blue: the water is being sucked there. The hub nose is red: it is the stagnation point, where the water hits head-on. On a propeller, this is the side that produces most of the thrust, and this is where cavitation threatens.
The legend on the right gives the scale in absolute pascals: from 107,876 Pa (blue) to 111,245 Pa (red), around a reference pressure of 110,085 Pa one metre below the surface. Keep those two numbers: they serve the cavitation question, further down.
5: The jet and the wake
Cuts colour the water itself, in a plane you choose. The vertical cut, seen from the side, shows the jet:
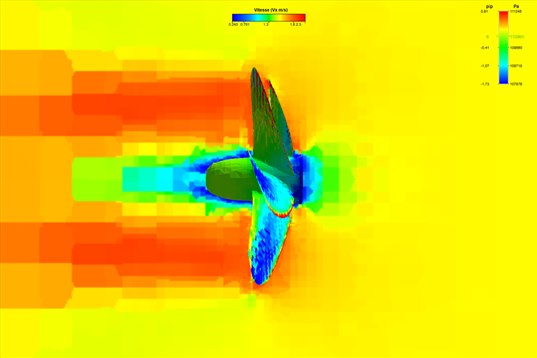
Vertical cut of axial velocity. Water arrives from the right at 1.6 m/s (yellow). Behind the propeller, on the left, the jet is accelerated to more than 2 m/s (orange-red). In the centre, in the shadow of the hub, a blue trail of slowed water: the hub wake.
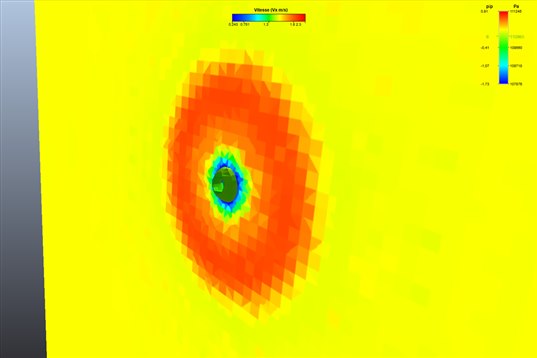
The same velocity, in a plane perpendicular to the shaft, just behind the propeller. The red ring is the jet of the blades; the blue disc in the centre is the water slowed behind the hub. This is the section of the stream tube a propeller makes.
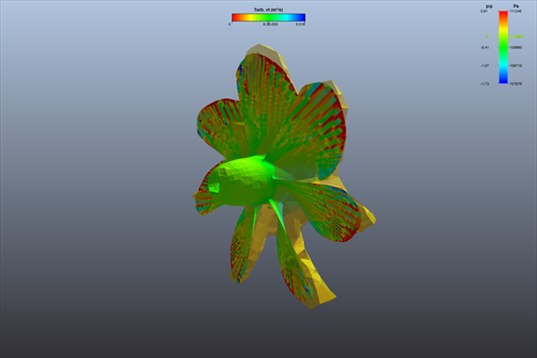
Iso-surfaces wrap the regions where the pressure crosses a given value: here two levels of suction, as yellow sheets around the blades. They show the extent in the water of what the pressure map showed on the skin.
6: The sailor's question: cavitation
Water vaporises when its pressure drops below the vapour pressure, 1,300 Pa at 10 °C. Bubbles form on the back of the blades, implode, eat the metal away and make the thrust collapse. CFD does not simulate the bubbles, but it gives the only thing needed to answer: the lowest pressure on the blades.
| Lowest computed pressure (bottom of the scale) | 107,876 Pa |
| Vapour pressure of sea water at 10 °C | 1,300 Pa |
| Margin | more than 100,000 Pa: no risk at this operating point |
No surprise for a propeller at 6.5 m/s at the blade tip. But the method holds for every propeller, and on a fast launch it gets tight. Three habits: read the bottom of the pressure scale, not the average; check on the front view that the darkest blue is indeed at the blade tip, where the water moves fastest; and remember that immersion shifts the whole scale: the same propeller 30 cm below the surface instead of one metre loses 7,000 Pa of margin. Immersion is set in the designer before the CFD case is created.
7: What vibrates: the blade pulsation
The second phase of the computation rotates the propeller for real. It brings information the frozen propeller cannot give: the fluctuation of the thrust at each blade passage.
| Blade passing frequency | 12.25 Hz (7 blades × 1.75 rev/s) |
| Simulated time | 0.49 s, i.e. 0.86 propeller revolution |
| Automatic stop | forces stable to within 1 % after 0.9 revolution |
The bench also computes a noise indicator from these fluctuations. Here, the line at 12.25 Hz stays 12 dB below the broadband noise: a slow, regular propeller. The absolute value is not a certified sound level, but the same indicator taken on two propeller variants ranks them against each other. It is this 12 Hz pulsation that fatigues a shaft line and can be heard inside a hull.
8: Take-aways
- Twelve minutes of computation on a desktop PC, without setting a single numerical parameter: one preset, two buttons.
- CFD finds 30 % less thrust than the classical calculation on this 7 wide-blade propeller: it is the interaction between blades, which only CFD sees. Margin to plan for, or variant to test.
- The pressure map answers the cavitation question with one reading of the scale: 107,876 Pa at the lowest, very far from the 1,300 Pa of vapour.
- What the computation does not contain: the hull ahead of the propeller (the water arrives uniform here, whereas a real propeller works in the wake of the sternpost), the free surface and the waves. Real fluctuations will be stronger than those computed here in open water.
The CFD case studies
« Previous: Understanding a CFD result in five pictures | Next: Aircraft propeller CFD: cruise and static thrust »
- Understanding a CFD result in five pictures
- Boat propeller CFD: thrust and pressure on the blades (you are here)
- Aircraft propeller CFD: cruise and static thrust
- Drone propeller CFD: hover
- Wind turbine CFD: power and wake
- Tidal turbine CFD: a 16 m rotor in the current
- Ducted fan CFD: duct and radiator
- Wing CFD and hydrofoil: lift and drag
These case studies complement the Heliciel design tutorials (in French), which cover the BEM side: blade design, choice of speed, performance curves. To go further into the method, the technical collection of twenty tutorials remains available.
 Global site map
 Mecaflux
 Tutorials Mecaflux Pro3D
 Tutorials Heliciel
 Mecaflux Store
 Compare software functions
 Quotes, Orders, Payment Methods
 project technical studies