
How much energy does it take from the wind, with what load on the mast? The wake in pictures.
Wind turbine CFD: watching the wind slow down and reading the power recovered
A wind turbine in CFD does the opposite of a propeller: instead of pushing the air, it lets itself be pushed and takes energy from it. The Heliciel designer draws the rotor and announces the shaft power; this case study shows, with the CFD (Computational Fluid Dynamics, numerical simulation of the flow) bench, the wind slowing down as it crosses the rotor, the wake widening behind it, and the two numbers that matter to the designer of a wind machine: the power recovered and the load the rotor transmits to the mast.
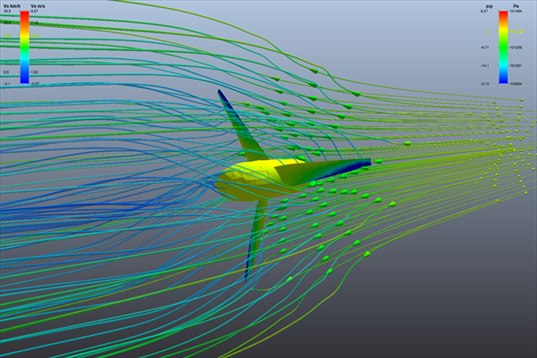
The 4 m three-blade rotor seen in perspective. The streamlines, coloured by speed, go from yellow (free wind) to blue-green (slowed) as they cross the rotor, and spread apart behind it: the stream tube widens. This is the signature of a machine that takes energy from the fluid, the opposite of a propeller whose jet narrows.
- Contents:
- The machine and the wind
- The two faces of the blade
- The wind turbine wake in CFD: the wind slows down
- Power and load on the mast: the wind turbine CFD figures
- Take-aways
1: The machine and the wind
| Rotor | 3 blades, diameter 4 m, hub ∅ 0.62 m |
| Wind | 5.5 m/s (20 km/h), air at 1.143 kg/m³ |
| Speed | 166.8 rpm, i.e. 35 m/s at the blade tip |
| Heliciel designer (BEM) | 231 N of thrust on the rotor, 35.9 N·m of torque |
The CFD computation was run with the Level 5 preset: 235,000 cells, 7 min 20 of meshing, then 1 min 04 for the first phase (frozen rotor, simulated rotation) and 29 minutes for the second (really rotating rotor), on a 6-core desktop PC. The second phase stopped on its own, forces settled.
2: The two faces of the blade
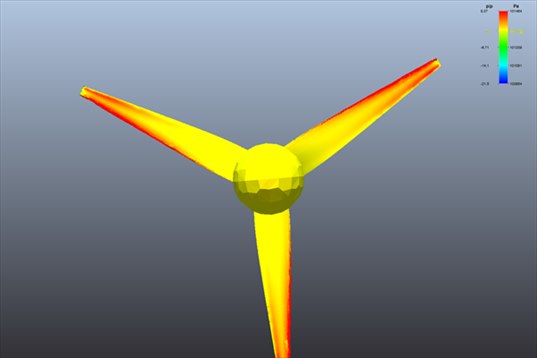
The rotor seen facing the wind, as from the ground in front of the machine. The whole exposed face is yellow-red: the wind presses on it. The red border along the leading edges marks where the air strikes the blade head-on.
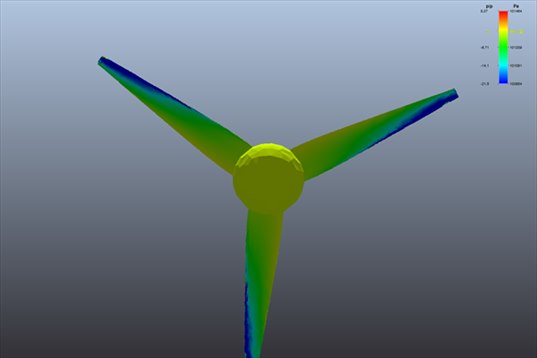
The same rotor seen from behind, nacelle side. The back of the blades is blue, in suction, especially towards the blade tips. It is the difference between the two faces, pressed on the yellow side and sucked on the blue side, that turns the rotor.
A wind turbine blade is a wing that rotates: the windward face is its lower surface, the back its upper surface. The colours say where the load concentrates: towards the blade tips, where the relative speed is highest. This is where the blade must be most carefully made, and where it wears.
3: The wind turbine wake in CFD: the wind slows down
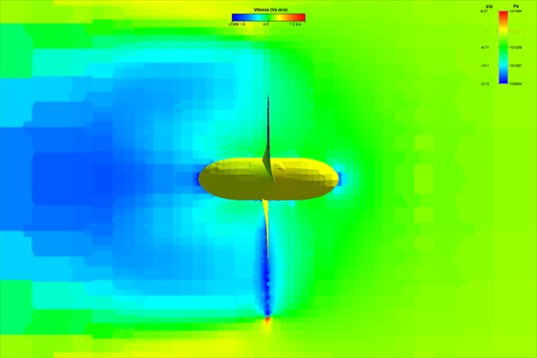
Vertical velocity cut, seen from the side. The wind arrives from the right in green (5.5 m/s). Behind the rotor, on the left, a wide blue zone: the wind has lost part of its speed, this is the energy the rotor took from it. The slowed wake is wider than the rotor and extends far behind: a second wind turbine placed there would receive less wind.
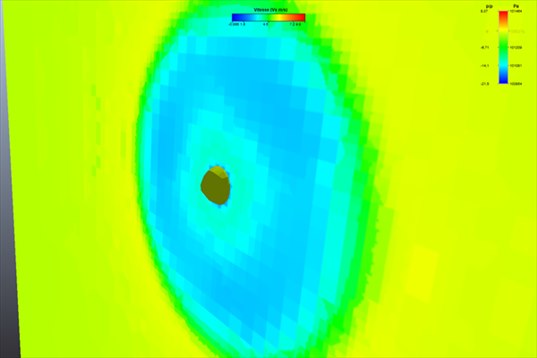
Cut perpendicular to the axis, just behind the rotor: the blue-green disc of slowed wind, surrounded by the free wind in yellow. Its diameter already exceeds that of the rotor.
These two pictures illustrate what every wind turbine designer knows from theory and rarely sees: the rotor cannot stop the wind, it slows it down. If it stopped it, nothing would pass through any more and it would recover nothing. The best compromise, the Betz limit, lets a third of the speed through: the blue zone tends towards that slowdown.
4: Power and load on the mast: the wind turbine CFD figures
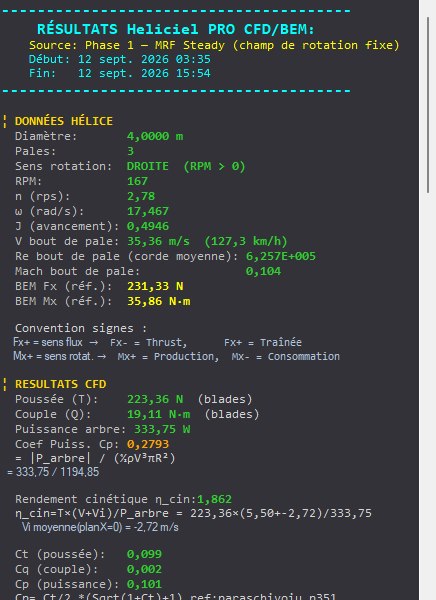
The results panel after the first phase: 223 N of thrust on the blades, 19.1 N·m of torque, 334 W at the shaft, power coefficient Cp 0.28. The designer's reference is recalled above: 231 N and 35.9 N·m.
| Thrust on the rotor | Torque | |
|---|---|---|
| Heliciel designer (BEM) | 231 N | 35.9 N·m |
| CFD, frozen rotor | 229 N (−3 %) | 19.0 N·m (−47 %) |
| CFD, rotating rotor | 231 N (−3 %) | 20.7 N·m (−42 %) |
Two very different results in the same table, and they must be read separately:
- The thrust is confirmed to within 3 %. It is the axial load the wind exerts on the rotor, the one that loads the mast, the foundations and the bearing. Both CFD phases and the designer say the same thing: 231 N. To size the structure, this is the figure to take, and it is solid.
- The torque, however, is much lower in CFD: 20 N·m against 36. The bench announces it itself in its alerts: "torque not reliable". On a wind turbine, the torque is a small difference between the lift of the blades and their friction, and friction on a blade with a 28 cm chord at 5.5 m/s depends on a state of the air layer at the surface that this mesh level does not capture. CFD underestimates the power here; the designer remains the best estimate for nominal power, CFD is worth it for the thrust, the wake and the pictures.
This is a general lesson, valid beyond this case: CFD is not uniformly reliable on every quantity. Axial loads, integrated over the whole surface, are robust; torques of lightly loaded machines depend on fine details. The Heliciel CFD bench flags this in its alerts, and this page repeats it so that nobody replaces a catalogue power by a poorly resolved CFD torque.
5: Take-aways
- The rotor slows the wind, it does not stop it: the velocity cut shows the blue wake, wider than the rotor, extending far behind.
- The thrust on the mast is confirmed to within 3 % by CFD, in both phases: 231 N for this 4 m rotor in a 20 km/h wind. This is the structural figure.
- The CFD torque is to be read with the bench alert: underestimated here, it does not replace the designer's power on a lightly loaded machine.
- A little over 35 minutes of computation for both phases, on a desktop PC.
The CFD case studies
« Previous: Drone propeller CFD: hover | Next: Tidal turbine CFD: a 16 m rotor in the current »
- Understanding a CFD result in five pictures
- Boat propeller CFD: thrust and pressure on the blades
- Aircraft propeller CFD: cruise and static thrust
- Drone propeller CFD: hover
- Wind turbine CFD: power and wake (you are here)
- Tidal turbine CFD: a 16 m rotor in the current
- Ducted fan CFD: duct and radiator
- Wing CFD and hydrofoil: lift and drag
These case studies complement the Heliciel design tutorials (in French), which cover the BEM side: blade design, choice of speed, performance curves. To go further into the method, the technical collection of twenty tutorials remains available.
 Global site map
 Mecaflux
 Tutorials Mecaflux Pro3D
 Tutorials Heliciel
 Mecaflux Store
 Compare software functions
 Quotes, Orders, Payment Methods
 project technical studies