
Propeller and hydrofoil cavitation: causes, effects and detection
Propeller cavitation is a local boiling of water: it appears when the pressure on the blade falls below the saturated vapor pressure. Vapor bubbles then form on the suction side, degrade thrust and eventually damage the blade. This page explains the causes of cavitation on propellers and hydrofoils, how to avoid it, and how Heliciel detects the risk during design.
On this page:
- What is propeller cavitation?
- How to avoid propeller cavitation
- Detecting the cavitation risk in Heliciel
- Causes of cavitation: lift and drag
- Choosing a profile to limit cavitation
- Lift and depression: where does the pressure drop come from?
1: What is propeller cavitation?
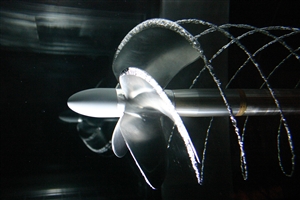
VEEM propellers in a cavitation test tunnel: stable sheet cavitation forms on the low-pressure side of the blade.
Cavitation is primarily a boiling of water. It appears when the ambient pressure falls below the saturated vapor pressure. Warming the water can cause it, and so can a pressure drop. On propellers and hydrofoils, it is mostly the local pressure drop that causes it, in the zones where the blade or wing accelerates the water.
Two quantities set the cavitation limit:
- The water temperature. The saturated vapor pressure of water is about 600 Pa (0.006 bar) at 0 °C and about 1,230 Pa (0.012 bar) at 10 °C. A pascal is one newton applied on 1 m². Cavitation therefore appears more easily in warm water than in cold water.
- The depth of immersion. It adds a static pressure to the water pressure, about 9.8 kPa per metre of fresh water, and so pushes the cavitation limit back. A propeller deep under water therefore cavitates later than a propeller close to the surface.
Here is the pressure on the surface of a tidal turbine blade, as shown by the Heliciel software:
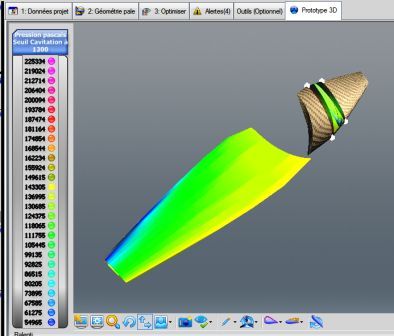
Pressure map on the blade (Prototype 3D tab): the colour scale, in pascals, places each zone relative to the cavitation threshold.
2: How to avoid propeller cavitation
Several levers move the blade away from cavitation.
Increase the area over which lift is applied:
- by increasing the propeller diameter;
- by increasing the chord width of the blades;
- by spreading lift over as much area as possible, through the profile shape, which determines the position of the point where lift is applied;
- by increasing the number of blades of a propulsion propeller.
Decrease lift:
- by decreasing the angles of attack of the profiles;
- by decreasing the rotational speed of the propeller.
Act on the environment:
- by increasing the depth of immersion, entered in the Optimize tab, to increase the static pressure;
- by lowering the liquid temperature: to change the temperature of the ambient fluid, and so its cavitation limit, click edit fluid in the "Project / fluid data" tab and select the temperature.
3: Detecting the cavitation risk in Heliciel
Let us look more closely at how cavitation appears and how to detect it while designing a propeller. Heliciel details the pressure distribution blade element by blade element.
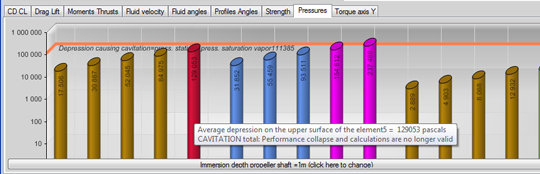
Pressions tab of the detailed results: one bar per element and per type of depression, on a logarithmic scale, and the cavitation limit line. The tooltip here shows a maximum concentrated depression of 106,418 Pa for element 4, with a possible cavitation pocket.
Heliciel distinguishes three types of depression on the propeller blade, to better assess the risk of performance loss:
- concentrated depression, when lift is applied symmetrically around the lift point;
- depression distributed over the surface, when lift is applied over the whole surface;
- drag depression, applied over an area equal to the frontal area.
The curves of these three risks as a function of rotational speed are plotted in the Optimize tab, with the analysis of multiple operating points:
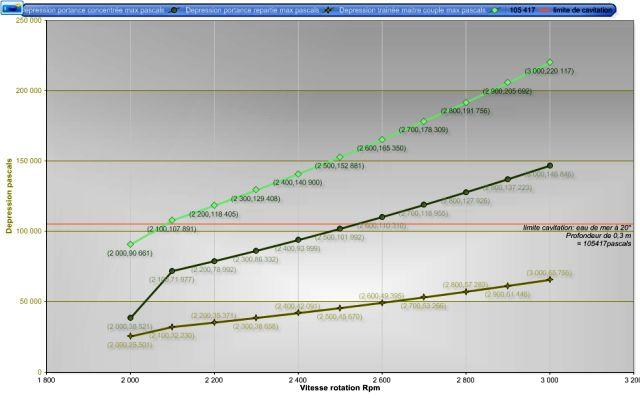
Maximum depression in pascals against rotational speed, with the cavitation limit (red line, 105,417 Pa for an immersion of 0.3 m in sea water at 20 °C). On this example propeller, the concentrated depression exceeds the limit from 2,100 rpm and the distributed depression at around 2,600 rpm; the drag depression stays below it.
Heliciel computes the depression of each blade element, from root to tip, for the three types above, and compares it with the cavitation limit set by the fluid and the depth of immersion. The bars are in the Pressions tab of the detailed results, where a button lets you display or change the immersion depth of the propeller shaft. The pressure on the blade is shown in 3D in the Prototype 3D tab.
4: Causes of cavitation on the blade: lift and drag
Two main sources of pressure drop, able to create cavitation, exist on our blade:
- Lift applied on the suction side results from the depression created by the profile shape. If this depression lowers the ambient pressure below the saturated vapor pressure, the blade cavitates. The cavitation then forms a gas pocket that covers the point of maximum depression, concentrated around the lift centre of the profile.
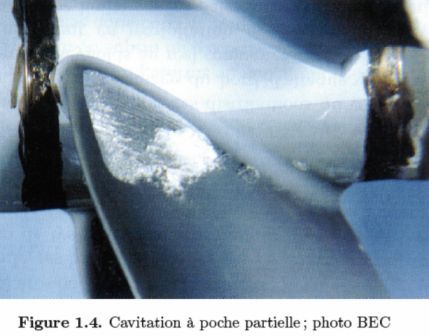
Partial pocket cavitation: the pocket covers part of the suction side of the blade.
As long as the pocket stays on the blade without going beyond the trailing edge, lift does not necessarily collapse, because the depression of the pocket keeps sucking the suction side. But the elasticity of the gas prevents lift from increasing as efficiently as in the liquid: any increase in lift turns into expansion of the gas. The pocket then grows, and its surface in contact with the suction side increases. This extra surface of depression allows lift to increase further, until the pocket reaches the trailing edge and covers the whole width of the profile: performance collapses. Some research even reports that a moderate pocket can improve performance because it reduces friction; we have not verified this claim here. The operating conditions of a propeller change constantly, and this range is very hard to master: we prefer not to risk a total loss of performance, and stay as far as possible from the cavitation zone. - The form drag of the profile also generates a depression, located on the rear of the profile. If this drag depression is applied over an area equivalent to the frontal area (the case of supercavitating profiles) and lowers the ambient pressure below the saturated vapor pressure, the blade can cavitate.
It is therefore essential to assess whether cavitation stays concentrated around the lift point or spreads over the whole surface of the profile.
5: Profile choice and cavitation: spreading the depression over the suction side
How does the profile shape manage the distribution of depression on the suction side, and therefore the tendency of the profile to cavitate? The lift applied on the suction-side surface of the blade gives the depression due to lift. But this lift is not applied uniformly: its point of application on profiles is generally around 0.25 times the profile chord from the leading edge. Heliciel reads this point in the profile database.
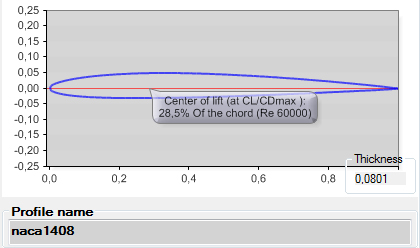
From the Heliciel profile database: the NACA 1408 has its lift centre at 31.4% of the chord.
The depression is concentrated around the lift point. We can estimate it roughly by assuming lift applied symmetrically around this point, that is 0.25 ahead and 0.25 behind for a point at 0.25 chord. The action area is then 0.5 times the suction-side area, and:
maximum depression = lift (N) / (0.5 × suction-side area)
If the point of application of lift is at 0.35 chord, Heliciel considers that the depression zone covers 0.35 × 2 = 0.7 times the suction-side area. A profile whose lift acts as close as possible to mid-chord (0.5) spreads its lift over the whole suction side and lowers the maximum depression. Profiles with a lift point set back are therefore less prone to cavitation.
How can we recognise a profile with a lift point set back? The angle of attack affects the position of this point, but let us leave it aside and look only at the shape of the profile. The curve below gives the pressure coefficient on a profile in Heliciel. The pink curve shows the distribution of depression on the suction side, and the blue curve represents the pressure side. Point 0 of the x axis is the leading edge and point 1 the trailing edge. The y axis is inverted: positive values are below the x axis.
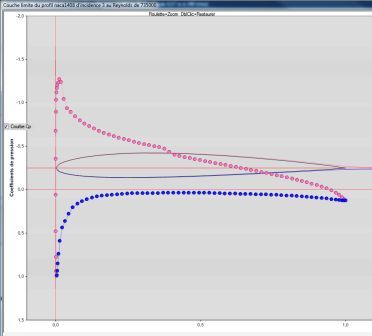
Distribution of the depression on the suction side (pink) and of the overpressure on the pressure side (blue) of a profile, at 3° angle of attack and a Reynolds number of 735,000: the depression peak sits very close to the leading edge.
If we give the profile an angle of attack, the point where the suction side becomes parallel to the fluid moves toward the leading edge. The zone where lift is concentrated shrinks, the depression concentrates, and cavitation appears more easily. To estimate the lift point on a profile, we can place it about halfway between the leading edge and the zone where the suction side becomes parallel to the stream.
Cavitation on the suction side of a profile under test: the sheet of bubbles covers the depression zone.
The further back the zone of maximum thickness, the longer the particles keep accelerating, and the more they spread their depression over a large area. The same lift force spread over a large area generates less concentrated depression. Propeller blade profiles working in water should therefore have their maximum thickness as far back as possible, so as not to cavitate too early.
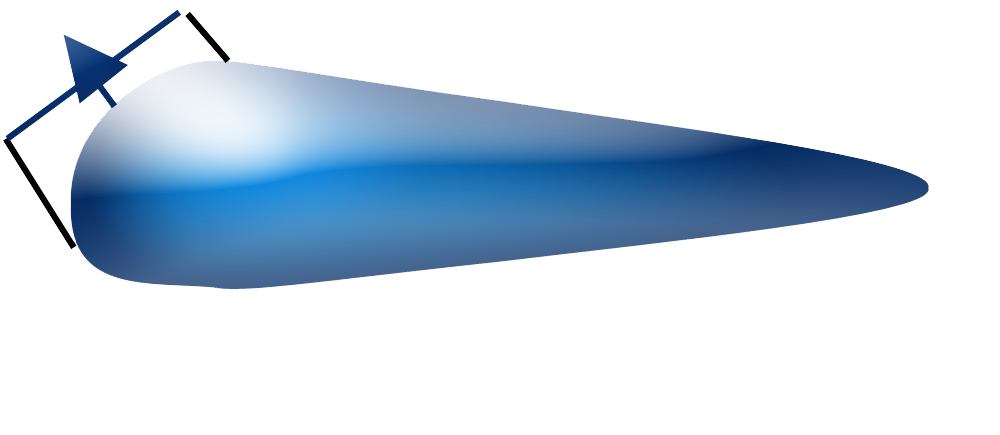
Three theoretical profiles illustrate these cases. The first has a strong concentration of lift at the front: it is likely to cavitate easily.
The second has a weak concentration of lift, but its poorly tapered rear is likely to generate a lot of drag. This profile may cavitate, not because of lift, but because of its drag.
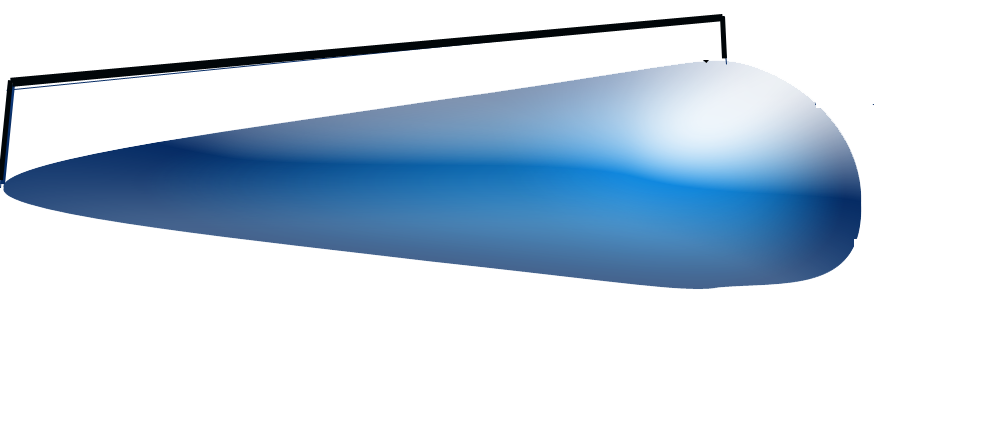
The third spreads its lift as well as possible without creating too much drag.

These shapes are given as examples: they generate no lift and do not have the qualities required for a propeller. Here is a more classical marine profile shape, taken from the Heliciel profile database:
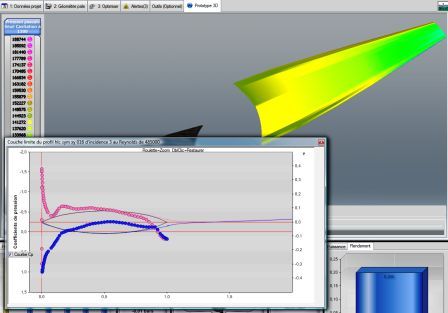
A classical marine profile, with its pressure curve in Heliciel.
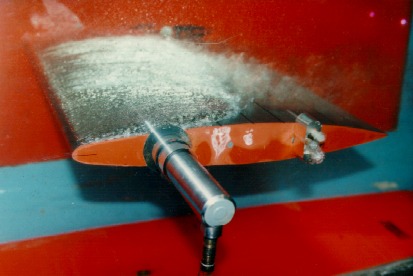
This photo of a foil whose maximum thickness is far back illustrates the importance of choosing profiles: it spreads its lift better than the vertical strut that supports it, and the cavitation appears on the strut.
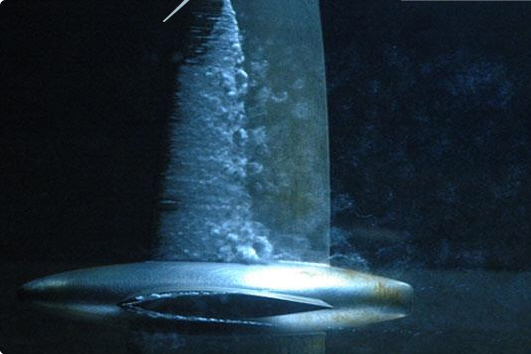
The foil, with its well-distributed profile, does not cavitate; the vertical strut that supports it does.
6: Lift and depression: where does the pressure drop on the suction side come from?
Several explanations complement each other. Bernoulli enlightens us with the law of conservation of energy in the fluid: the sum of pressure energy and kinetic energy is constant for a given volume of fluid. If the fluid accelerates, the energy spent on acceleration is taken from its pressure, which decreases; if it slows down, its pressure increases. Acceleration on the suction side and slowing on the pressure side therefore explain part of the depression on the suction side and of the overpressure on the pressure side.
A frequently heard explanation attributes this acceleration to the difference in path length between the suction side and the pressure side, which particles would have to cover in the same time. This explanation is wrong: nothing forces two neighbouring particles to reach the trailing edge at the same instant. Nor does it suffice to explain the whole of lift.
The rest of lift comes from the change of momentum, generated by the change of direction the profile imposes on the fluid. This second explanation is the more realistic one.
One thing is certain: a depression forms on the suction side and an overpressure on the pressure side, when the angle of attack generates lift. Lift is concentrated in the zone between the leading edge (just after it) and the point where the fluid is no longer forced to change direction. At zero angle of attack, this zone is the zone of maximum thickness.
Cavitation is a complex subject, which this page covers only superficially. To go deeper, we invite you to read the thesis on cavitation by Surasak Phoemsapthawee, which is in my humble opinion a valuable reference.
To go further, we can see how the profile shape sets the lift point, how the ambient fluid changes the cavitation limit, or how the blade element theory computes the pressures.
The minimum pressure on the blade can be read directly on a pressure map: the case study boat propeller CFD shows how to assess the cavitation risk of a marine propeller by simulation.
 Global site map
 Mecaflux
 Tutorials Mecaflux Pro3D
 Tutorials Heliciel
 Tutorials Heliciel PRO CFD
 Mecaflux Store
 Compare software functions
 Quotes, Orders, Payment Methods
 project technical studies