
Propeller and wing performance curves: thrust, torque, efficiency and motor speed
The performance curves of a propeller or wing show how thrust, torque, power and efficiency change when the rotation speed or the fluid speed changes. Heliciel edits them with the Multiple analysis function, which calculates the same geometry at several operating points. These charts let us think through the forces, powers and efficiency of our system, and find the real speed of a propeller coupled to an electric motor or a generator.
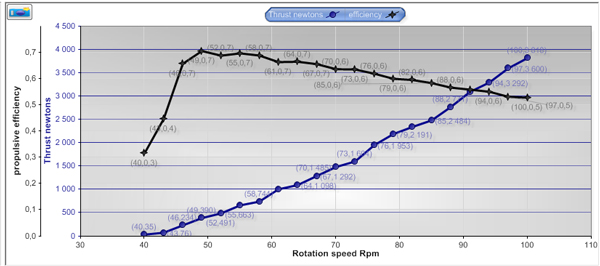
An example of propeller performance chart: thrust and propulsive efficiency versus rotation speed. Efficiency peaks near 0.7 around 50 rpm, while thrust keeps rising to about 3,800 N at 100 rpm.
In this page:
- Editing performance curves with the multiple analysis
- Opening the multiple analysis
- Choosing the varying parameter and the test range
- Choosing the calculation mode: refreshing twist or off design
- Running the analysis and reading the curves
- Finding the real speed of an electric motor or generator
- Checking strength and cavitation at the speeds found
1 : Editing performance curves with the multiple analysis
A series of charts shows the performance of the propeller at several rotation speeds (for propellers), or at several fluid speeds (for wings). It lets us think through the forces, powers and efficiency of our system.
The multiple analysis plots curves and collects the « off design » performance of a fixed propeller geometry. That geometry may have come from the function rebuild the optimum twist, or be determined in reverse engineering mode, to model an existing propeller. The page on multiple analysis of operating points details the function, and the one on Kt, Kq and J covers a marine propeller in open water.
2 : Opening the multiple analysis
To display the multiple analysis interface, click Multi Analysis in the Heliciel toolbar:
The « Multi Analysis » button of the toolbar, next to the buttons that open and save the project.
You can also use, in the 3: Optimize tab, the multiple analysis button.
3 : Choosing the varying parameter and the test range
Determine the varying parameter. An operating point is determined by the fluid speed and the rotation speed. The varying parameters of the analysis are therefore the fluid speed, in m/s, and the rotation speed, in rpm. You choose one of the two; the other stays at the value of the project.
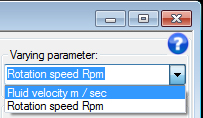
Selection of the varying parameter: fluid velocity or rotation speed.
Determine the test range. The varying parameter is tested between a minimum and a maximum that you enter. Heliciel divides this range into as many points as you ask for in the Number points field, and displays the resulting test increment. In the example below, the range runs from 40 to 100 rpm with 21 points, which gives a test increment of 3 rpm.
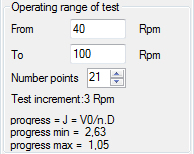
The operating range to test: from 40 to 100 rpm, 21 points, increment of 3 rpm.
4 : Choosing the calculation mode: refreshing twist or off design
Two modes of calculation of the operating points are offered:
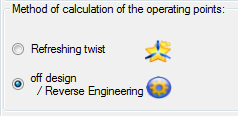
- Refreshing twist: if you want the optimum twist to be adapted to each operating point tested, Heliciel updates the twist and calculates the performance of the propeller at each test point. You can then check the optimum performance your propeller offers, with the given blade dimensions.
- Off design / Reverse Engineering: the twist and pitch setting of the propeller stay constant, and the propeller is analysed in off-design mode. You thus see how the performance of a given propeller evolves away from its design point.
The difference matters for reading the results: the first mode answers « what would a propeller perfectly adapted to each point give? », the second « what does my propeller give, as it is, when conditions change? ». The page on off-design calculation develops the second case.
5 : Running the analysis and reading the curves
All that remains is to start the analysis with the Multi-point analysis button. The charts can be saved, a Compare chart displays the curves you choose, and the calculation data can be saved as text (.txt) or spreadsheet (.xls). A tick box for each curve (thrust, torque, shaft power, power output, coefficients Ct and Cp, figure of merit, delta pressure, maximum depression for cavitation...) lets you compose the chart you want.
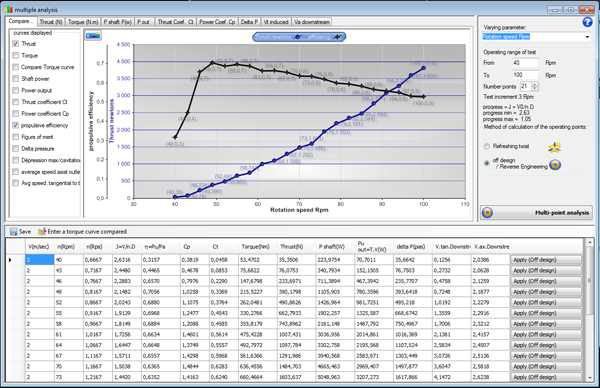
The multiple analysis window: on the left the list of curves to display, in the centre the thrust and efficiency curves versus rotation speed, on the right the analysis settings, at the bottom the results table point by point.
The test ranges you choose can give results that fall completely outside the propeller's normal operation, with negative efficiencies for instance. Below, the range of rotation speeds tested for this propulsive propeller tells us that at a fluid speed of 2 m/s, efficiency is negative from 50 to 70 rpm (about −0.4 at 50 rpm): the propeller then works as an energy harvester. It turns positive from 80 rpm and reaches about 0.2 around 100 to 140 rpm.
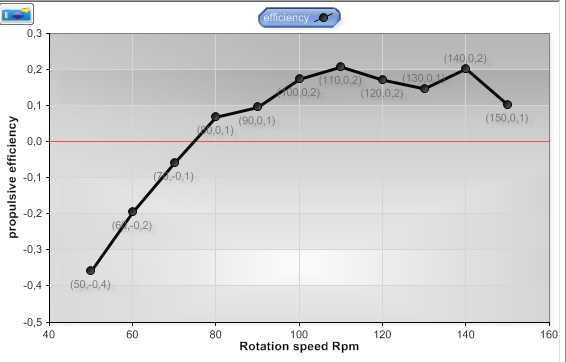
Propulsive efficiency versus rotation speed at 2 m/s: negative below 80 rpm, about 0.2 from 100 to 140 rpm. The chart labels are rounded to one decimal.
6 : Finding the real speed of an electric motor or generator
Research of the actual rotation speed (operating point) for electric motors and generators coupled to propellers.
- The rotation speed of an electric motor is changed by the resisting torque applied to it. Its actual operating speed is the speed at the intersection between the motor torque curve and the load torque curve of the propeller.
- For a wind-turbine-type generator driven by an energy-capture propeller, the problem is the same: we have to find the speed at the intersection between the load torque curve of the generator and the torque curve of the propeller.
In both cases, the actual rotation speed of the system is determined by the balance between the driving torque and the resisting torque.
To see quickly the rotation speed of your generator/propeller or electric motor/propeller system, simply overlay the torque curve of the propeller and the torque curve of the motor or generator. To make this graphical resolution easier, you can insert your torque curve, supplied by the motor or generator manufacturer, with the command Enter a torque curve compared. It then appears superimposed.
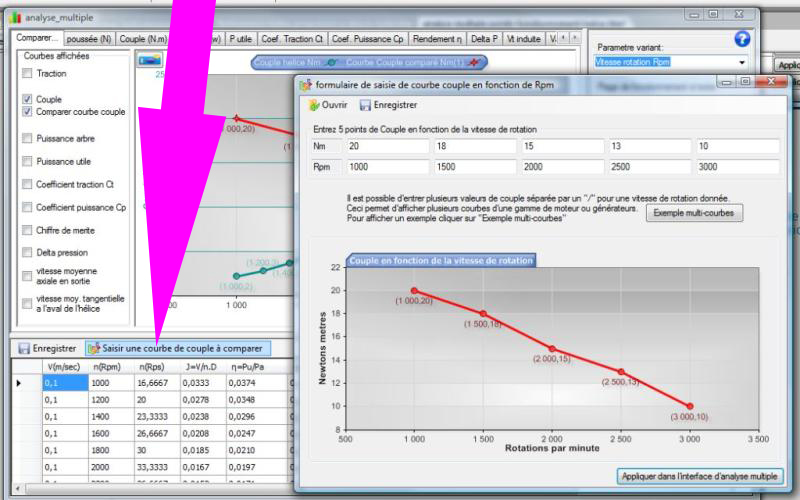
The input form for the torque curve versus rotation speed: five torque points (in N·m) for five speeds (in rpm), here 20, 18, 15, 13 and 10 N·m from 1,000 to 3,000 rpm. The button at the bottom applies it in the multiple analysis interface, over the propeller curves.
It is thus possible to enter several torque curves, representing several motors or generators (three motor curves in the example below), and then to edit performance curves versus rotation speed. You see directly the rotation speeds and the performance of the same propeller mounted on a range of motors or generators of different powers.
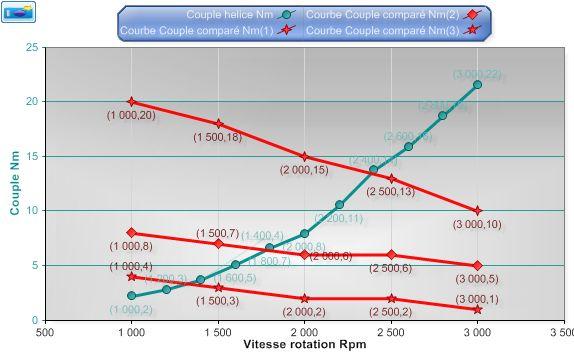
The propeller torque curve rises with speed; the three motor curves fall. Each intersection gives the rotation speed of the motor-propeller pair.
Here we find that:
- the propeller mounted on the weakest motor (4 N·m at 1,000 rpm) will run at about 1,300 rpm;
- the propeller mounted on the intermediate motor (8 N·m at 1,000 rpm) will run at about 1,750 rpm;
- the propeller mounted on the strongest motor (20 N·m at 1,000 rpm) will run at about 2,400 rpm.
We can also overlay the power and thrust data, to know the performance of the system in the three cases:
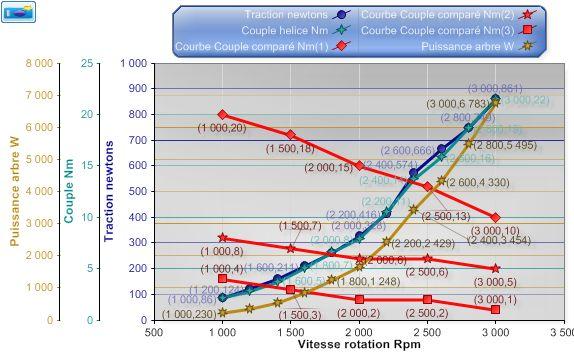
Thrust (N), torque (N·m) and shaft power (W) of the propeller versus rotation speed, with the three motor torque curves overlaid.
Here we find that:
- the propeller on the weakest motor will deliver a thrust of about 150 N at 1,300 rpm; its shaft power is the torque read at the intersection (about 3.4 N·m) times the angular speed (136 rad/s), that is of the order of 460 W;
- the propeller on the intermediate motor will deliver about 250 N at 1,750 rpm, with a shaft power of about 1,200 W;
- the propeller on the strongest motor will deliver about 550 N at 2,400 rpm, with a shaft power of about 3,400 W.
These values are read from the charts, to within reading precision: the analysis table gives the exact values.
The speed here is a value deduced from the balance of torques, not a value you impose. The three torque curves, one per motor or generator, are entered in the multiple analysis, from the torques read in the manufacturer's data sheet. To search directly for the speed that gives the best efficiency, see optimizing speed and number of blades.
7 : Checking strength and cavitation at the speeds found
Of course, these values are valid only if the propeller has a mechanical strength suited to the calculated thrust, and if cavitation does not vaporise the fluid. We must therefore check these parameters at the rotation speeds found.
To go further, we can search for the speed and number of blades that give the best efficiency, or read all the results of a calculation: results of propeller and wing calculations.
 Global site map
 Mecaflux
 Tutorials Mecaflux Pro3D
 Tutorials Heliciel
 Tutorials Heliciel PRO CFD
 Mecaflux Store
 Compare software functions
 Quotes, Orders, Payment Methods
 project technical studies